A Web UI for DNSvizor
2025-06-18TL;DR: DNSvizor now has a web UI and reports metrics. We are continuing our work on DNSvizor (repository).
Web UI
DNSvizor now has a web UI which shows statistics about the amount of clients, queries, used memory, etc.
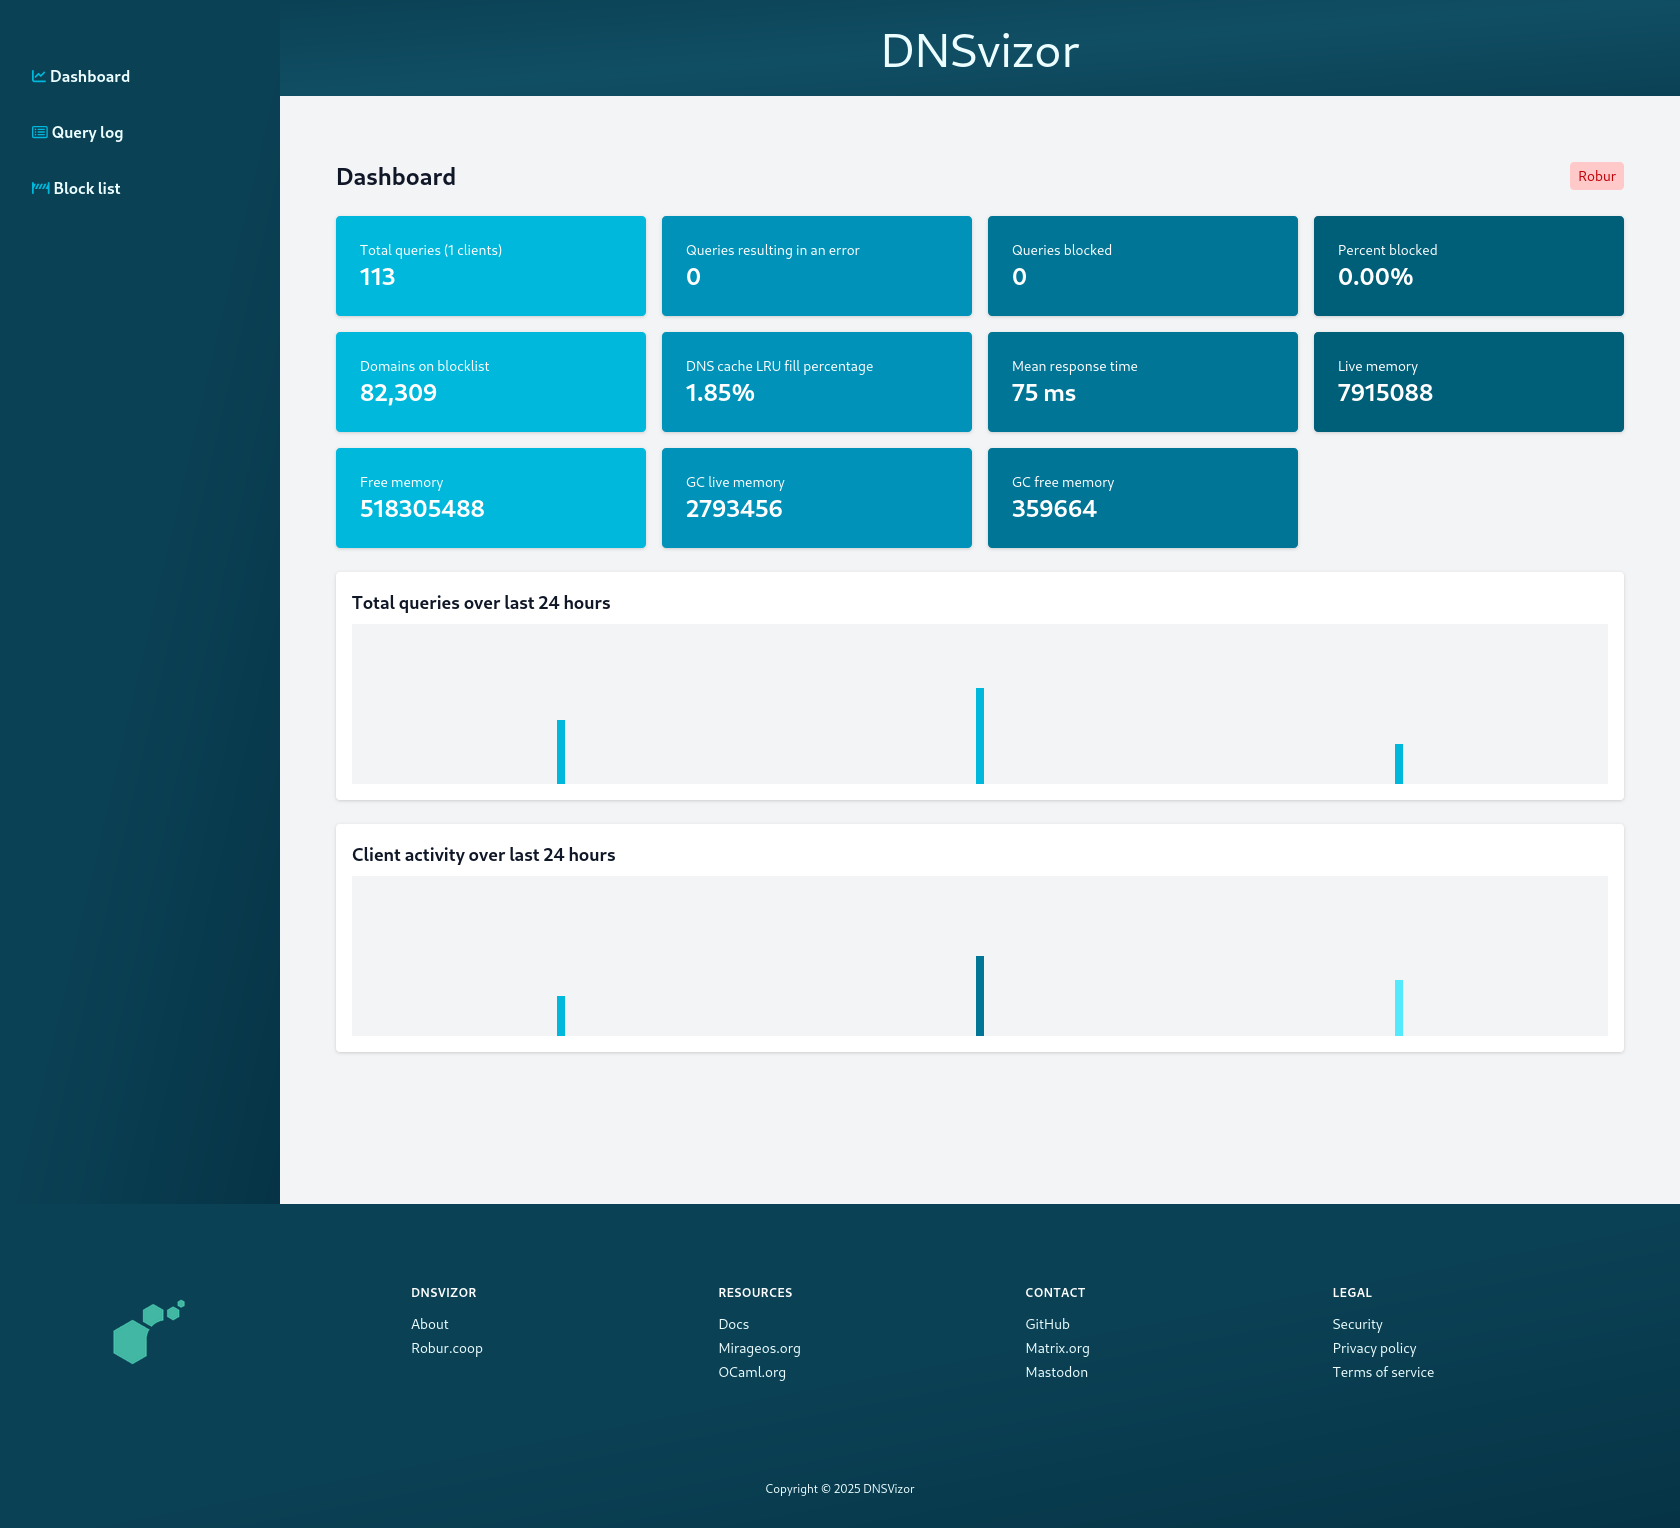
The idea is to extend this web UI to be able to configure DNSvizor, and get a quick idea what is going on in the DNSvizor unikernel - in terms of memory used, which queries are active, which are blocked and why, ...
We will also extend the web UI with configuring DNSvizor, so you don't have to remember all the command line arguments for it.
The initial web UI PR was followed by more statistics and a cleaned up UI.
Metrics
We collect counters using the OCaml metrics library, which we extended to serve our purpose.
This library doesn't use much resources, especially if there's nothing interested in receiving these metrics. It has a push interface (the function report is called for each new measurement). With the cache_reporter, which we use, this preserves each measurement in a map, and thus provides a pull interface.
Now, since we have these statistics, we are also able to push them into a time series database, e.g. InfluxDB. Of course, there's nothing preventing us from providing a Prometheus endpoint if that is desired.
The design and implementation of metrics is in this regards very flexible, since the code where measurements are taken (Metrics sources) are independent of the code that reports the statistics in your favourite way (the reporter - as shown here a custom web UI, or InfluxDB).
The statistics gathering was done in a series of PRs: first a fix of memory usage, then some added statistics, and even more statistics.
Allowing to push the metrics to influx was achieved in a separate PR.
We also worked on a new metrics release, which adds some functionality, and fixing the cache-reporter. The new release (0.5) is still pending.
As we have not yet implemented block lists the numbers for "domains on blocklist" and "percent blocked" are made up. We plan on adding these metrics once it's implemented. Likewise, we don't yet have time series capabilities built-in so the graphs are as well made up. If using InfluxDB you can make the graphs there :-)
Conclusion
DNSvizor provides DNS resolution and DHCP service for your network - and now comes with a web UI and metrics. It already exists :). Please report issues you encounter and questions you may have. Also, if you use dnsmasq, please show us your configuration.