Dynamic Logging and Metrics with Mollymawk
2026-05-31Visualizing metrics and adjusting log levels is a crucial aspect of understanding the health of your running unikernels. In this article, we'll explore how you can adjust metrics and logging of your unikernels manually, and in the second part, see how Mollymawk simplifies this process.
Prerequisites
1. Install Albatross and Solo5
Install the packages from our reproducible build server:
$ curl -fsSL https://apt.robur.coop/gpg.pub | \
  gpg --dearmor > /etc/apt/trusted.gpg.d/apt.robur.coop.gpg
$ echo "deb [signed-by=/etc/apt/trusted.gpg.d/apt.robur.coop.gpg] https://apt.robur.coop ubuntu-20.04 main" > /etc/apt/sources.list.d/robur.list # replace ubuntu-20.04 with e.g. debian-11 on a debian buster machine
$ apt update
$ apt install solo5 albatross
Setup albatross (and eventually a CA for the future, i.e. for mollymawk)
2. Network configuration
You will need two bridges, we use the names service and management for this article. On the service interface, we will use the network 10.0.0.1/24 - while on the management we'll use 192.168.0.1/24.
$ ip link add name service type bridge
$ ip addr add 10.0.0.1/24 dev service
$ ip link add name management type bridge
$ ip addr add 192.168.0.1/24 dev management
$ ip link set service up
$ ip link set management up
We also need to allow unikernels on the service bridge to communicate to the Internet. We do this using a firewall and NAT via the wireless network interface "wlan0" (you may need to adapt if your uplink is different):
$ iptables -t nat -A POSTROUTING -s 10.0.0.0/24 -o wlan0 -j MASQUERADE
$ iptables -A FORWARD -i service -o wlan0 -j ACCEPT
$ iptables -A FORWARD -i wlan0 -o service -m state \
    --state RELATED,ESTABLISHED -j ACCEPT
Part A: Deploying a unikernel manually with monitoring.
We will deploy a unikernel, called unipi, with monitoring support. Unipi is a MirageOS unikernel that provides the contents of a git repository via HTTP and HTTPS. We will use DNSvizor for dynamic address allocation on the monitoring network.
Note: Unikernels need to be compiled with mirage-monitoring to have monitoring support.
Step 1: Deploying DNSvizor
We will hand out IP addresses on the mangement interface with DNSvizor. We will use the domain named "management". The "ca-seed" is a base64-encoded random.
Download dnsvizor from https://builds.robur.coop/job/dnsvizor/build/latest
Launch it using albatross:
$ albatross-client create user:dnsvizor dnsvizor.hvt \
  --mem 128 --net service:management \
  --arg='--ipv4=192.168.0.2/24 --ipv4-only \
    --dhcp-range=192.168.0.10,192.168.0.100 \
    --domain=management --ca-seed=1234'
You should be able to reach it with ping 192.168.0.2. You should as well be able to browse https://192.168.0.2 (you have to accept the bad certificate).
For DNS resolution, you should be able to ask DNSvizor for its own name:
dig dnsvizor.management @192.168.0.2- which should return
192.168.0.2
- which should return
dig -x 192.168.0.2 @192.168.0.2- which should return
dnsvizor.management
- which should return
Step 2: Deploying Unipi
Download unipi from https://builds.robur.coop/job/unipi-monitoring/build/latest
Launch it using albatross:
Note: For unipi, or any unikernel that you want to monitor, you need to pass the
--monitorargument to enable monitoring. It expects an IP address of a monitoring server running influxdb/telegraf.
$ albatross-client create user:unipi unipi.hvt \
  --mem 128 --net service --net management \
  --arg='--ipv4=10.0.0.2/24 --ipv4-gateway=10.0.0.1 \
    --remote=git://git.robur.coop/robur/blog.robur.coop.git#gh-pages \
    --default-mime-type=text/html \
    --mime-type "/atom:application/atom+xml" \
    --monitor=192.168.0.2' # NOTE replace with the IP of influx/telegraf
You should be able to connect to unipi:
ping 10.0.0.2- browse
http://10.0.0.2-- and see robur's blog
Also, you should be able to observe the management interface of unipi:
dig unipi.management @192.168.0.2- this should output an IP address, let's assume this IP is
192.168.0.9
- this should output an IP address, let's assume this IP is
Step 3: Monitoring - adjusting metrics and log levels
At this point, we can now adjust the metrics and log levels of this unikernel.
Let's assume the IP from the previous step is 192.168.0.9.
1. Logging
First, let's explore how to inspect and adjust the log levels of the running unikernel.
- To view all the active log sources and their current levels:
$ echo -n l* | nc -t 192.168.0.9 2323
This should output:
ok: *:info,paf-layer:info,paf-tls:info,paf-tcp:info,tcp.mirage:info,tcp.user:info,tcp.timer:info,tcp.input:info,tcp.segment:info,tcp.subr:info,tcp.state:info,tcp.tracing:info,tcpip-stack-direct:info,ipv6:info,ndpc6:info,icmpv4:info,paf-alpn:info,netif:info,mirage-monitoring:info,mirage-crypto-rng-mirage:info,letsencrypt.mirage:info,letsencrypt:info,http_mirage_client:info,git.paf:info,paf-client:info,paf-server:info,paf-flow:info,git-kv:info,git.search:info,git.sync:info,git-fetch:info,push:info,pck:info,git-sync.fetch:info,smart.flow:info,git.sync.mstore:info,carton-lwt:info,carton.idx:info,cartonnage:info,git.store:info,git.traverse:info,git.blob:info,carton:info,mimic:info,dns_client_mirage:info,handshake:info,tls.config:info,tls.tracing:info,happy-eyeballs.mirage:info,happy-eyeballs:info,dns_client:info,dns_cache:info,dns:info,dhcp_client_mirage:info,dhcp_client_lwt:info,ipv4:info,ipv4-fragments:info,udp:info,awa.mirage:info,awa.client:info,awa.authenticator:info,awa.server:info,x509.validation:info,x509.decoding:info,mirage-crypto-rng-entropy:info,ARP:info,ethernet:info,application:info
- To change the log level for all sources:
$ echo -n 'L*:debug' | nc -t 192.168.0.9 2323
This should output:
ok
Note: You can also specify log levels for specific sources individually or in a comma-separated list (e.g.
L*:info,netif:debug).
2. Metrics
Next, we can look at the metrics sources that the unikernel monitors and reports.
- To view all metric sources and their status:
$ echo -n m* | nc -t 192.168.0.9 2323
This should output:
ok: *:enabled,logs:enabled,gc:enabled,http_response:enabled,utcp_transition:enabled,utcp:enabled,net-solo5:enabled,memory:enabled,sleep:enabled,dns-cache:enabled
- To disable or enable metrics for a given source:
For example, we will disable metrics for dns-cache and enable it for all other sources:
$ echo -n 'M*:enable,dns-cache:disable' | nc -t 192.168.0.9 2323
This should output:
ok
Part B: Using Mollymawk to adjust log levels and metrics
Mollymawk provides a simple UI to achieve all the steps mentioned in Part A. Mollymawk was recently updated to have a new network interface, "management", which can be used alongside DNSvizor. With this, mollymawk can say, I want to connect to blog.robur.coop on the "management" interface and it will resolve the IP address from DNSvizor. This removes the need to pass static IP addresses around.
Step 1: Deploying with Mollymawk
With mollymawk, you don't need to download any unikernel binaries if it exists on builds.robur.coop. All you need to do is select the unikernel from the list and provide the command-line arguments. (Mollymawk can also deploy downloaded binaries.)
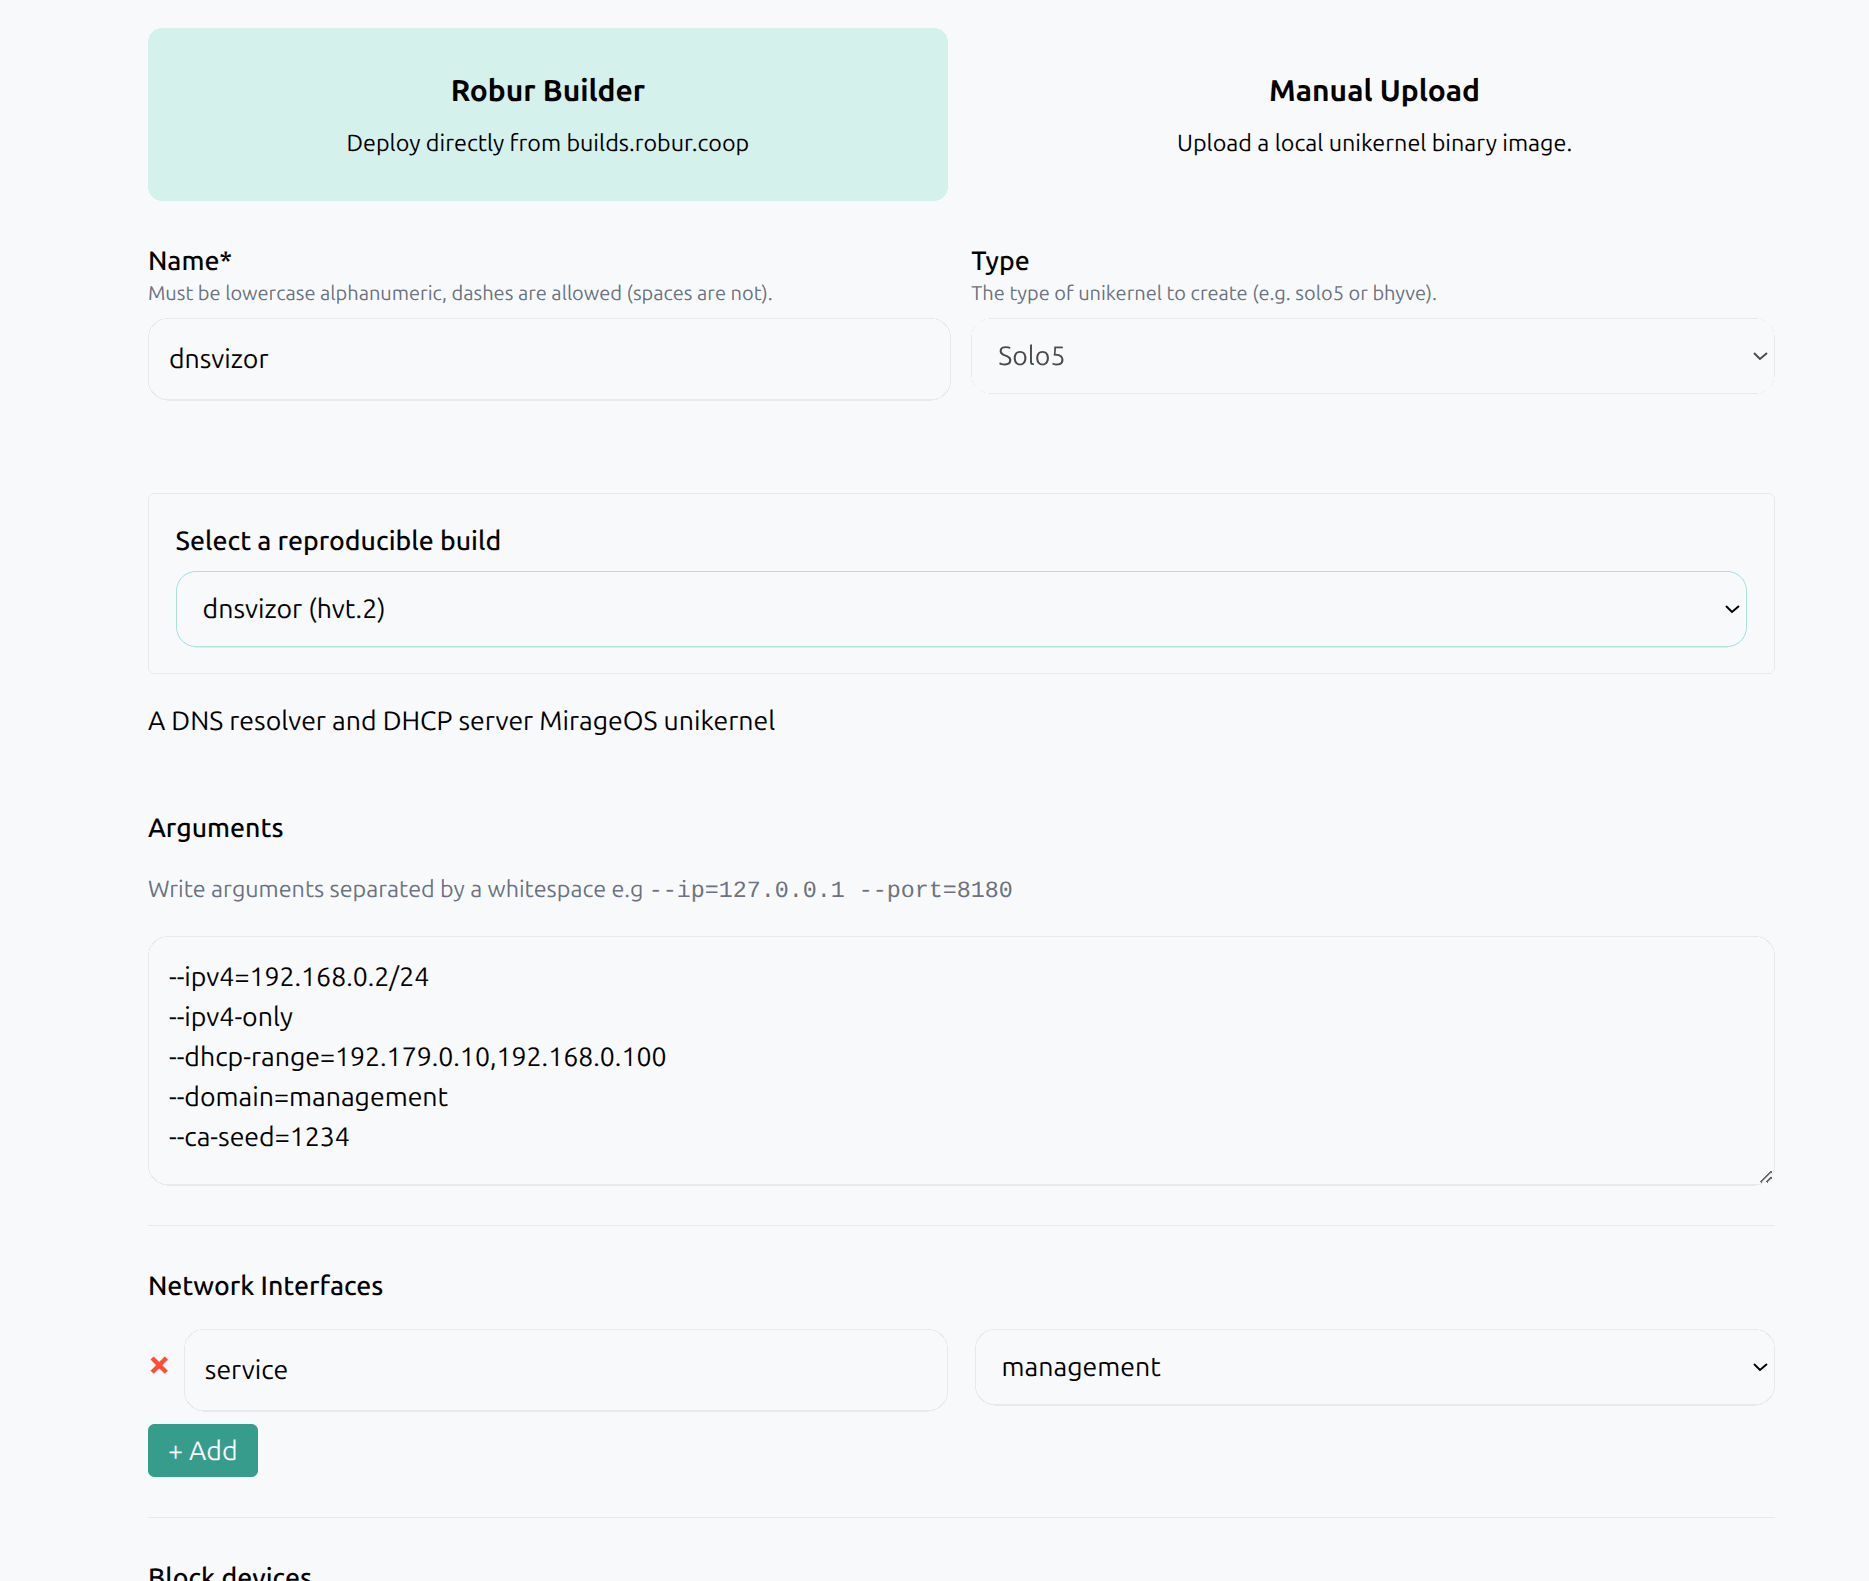
Mollymawk is able to figure out dynamically if a unikernel requires network devices or block devices, and there's an advanced configuration button which you can use to fine-tune more settings, such as memory etc.
We will follow the same steps to deploy the unipi unikernel.
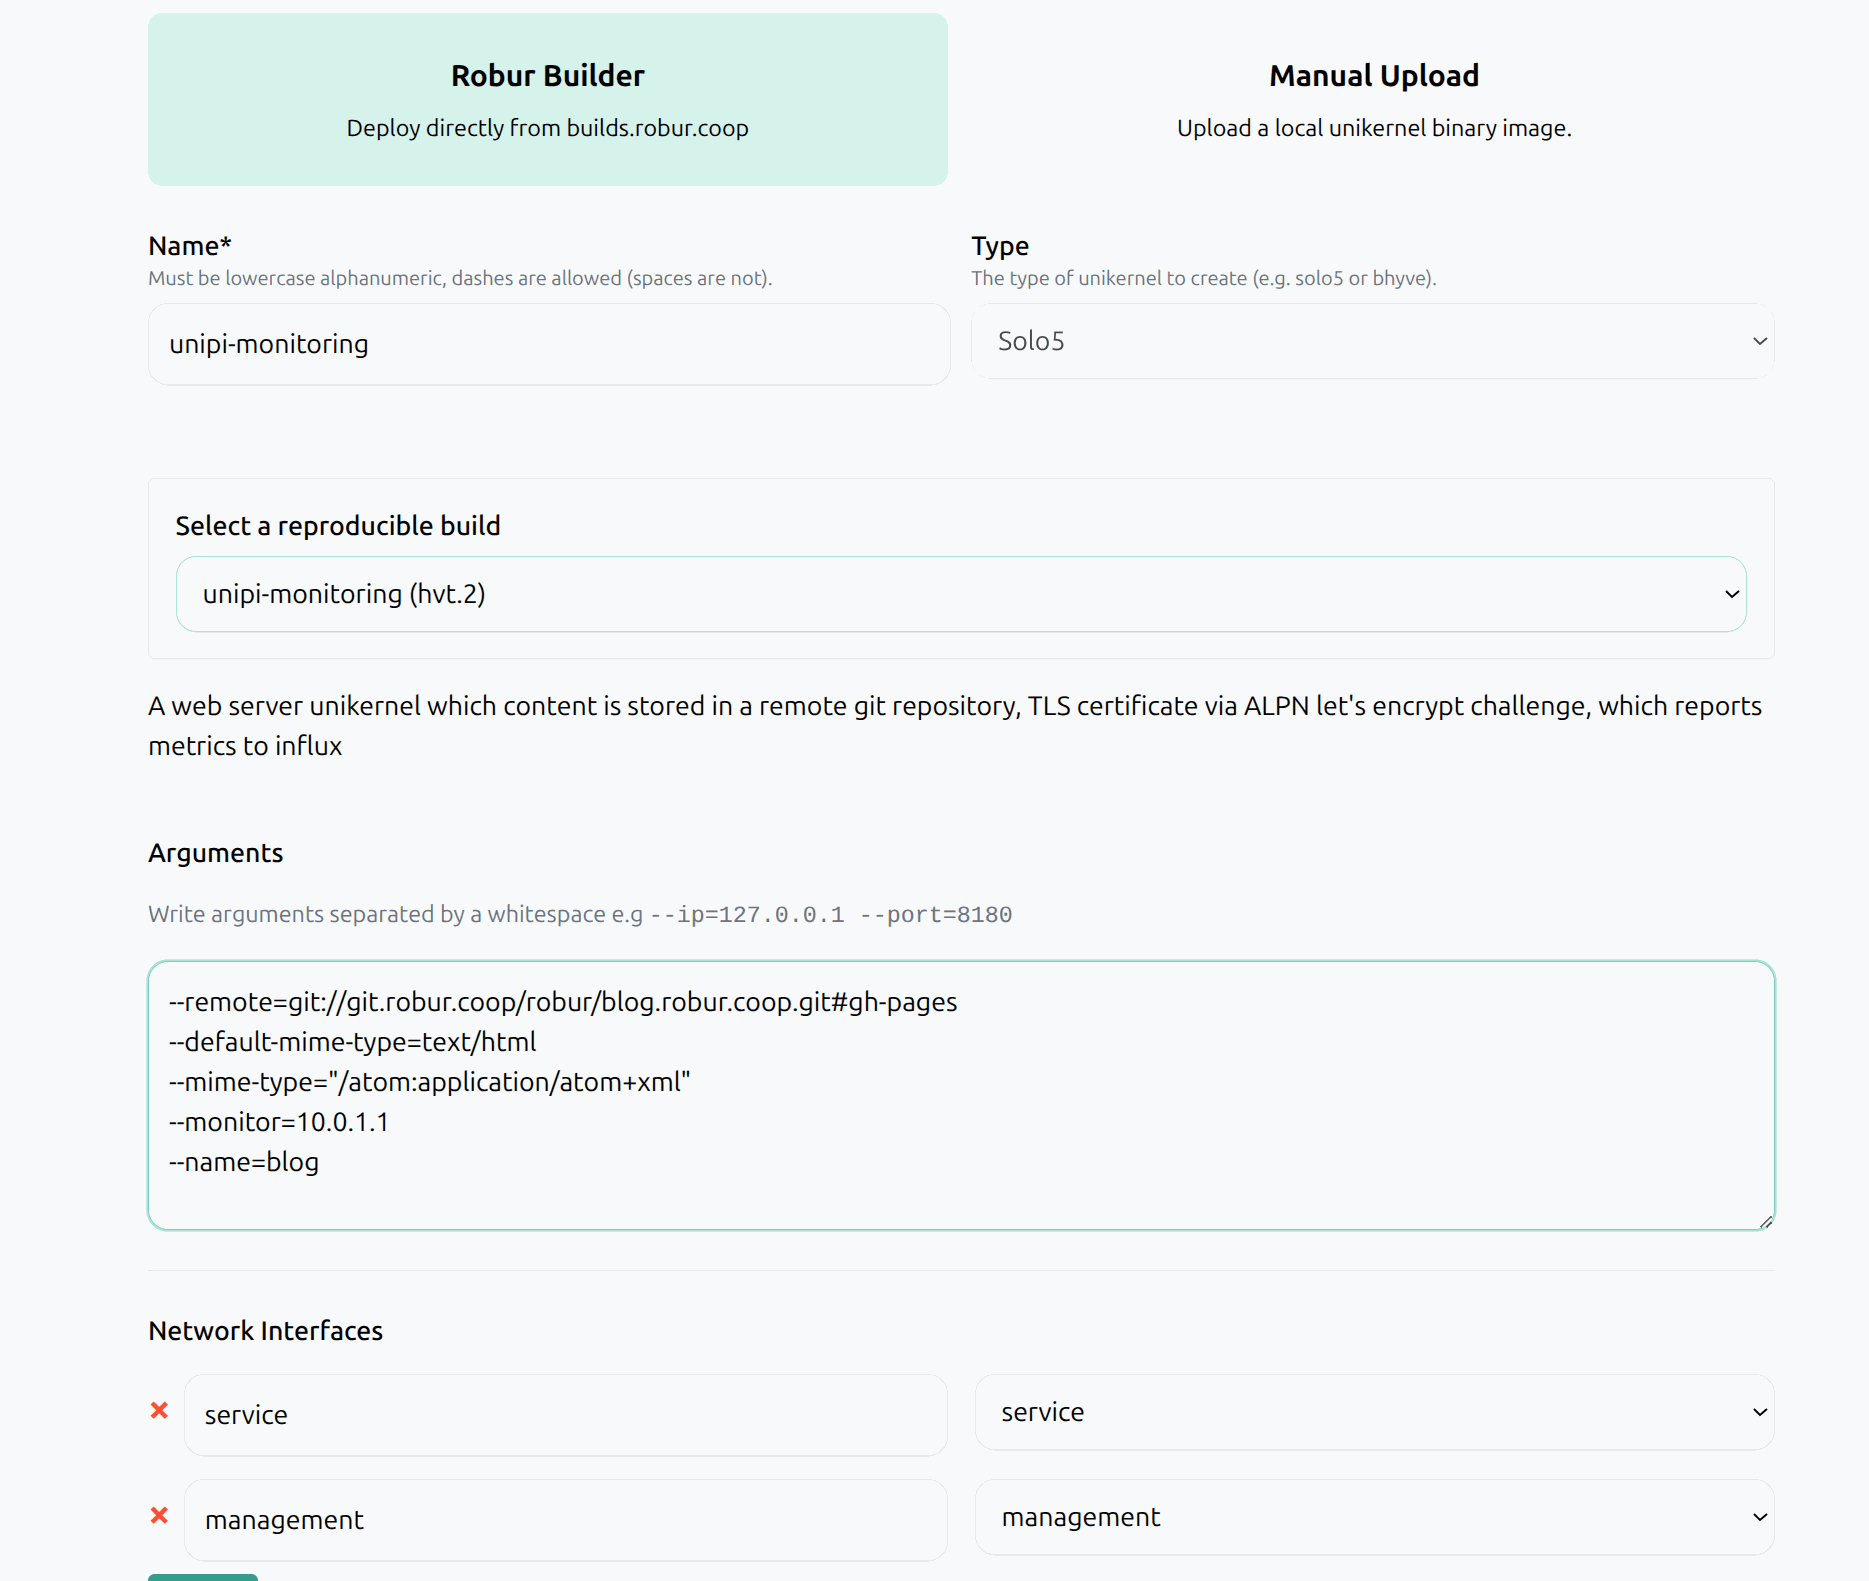
Note: For unipi, or any unikernel that you want to monitor, you need to pass the
--monitorargument to enable monitoring. It expects an IP address of a monitoring server running influxdb/telegraf.
Step 2: Adjusting metrics and log levels
Once both unikernels are deployed, open the unipi unikernel and you should see a button, "Configure Monitoring" on the dashboard.
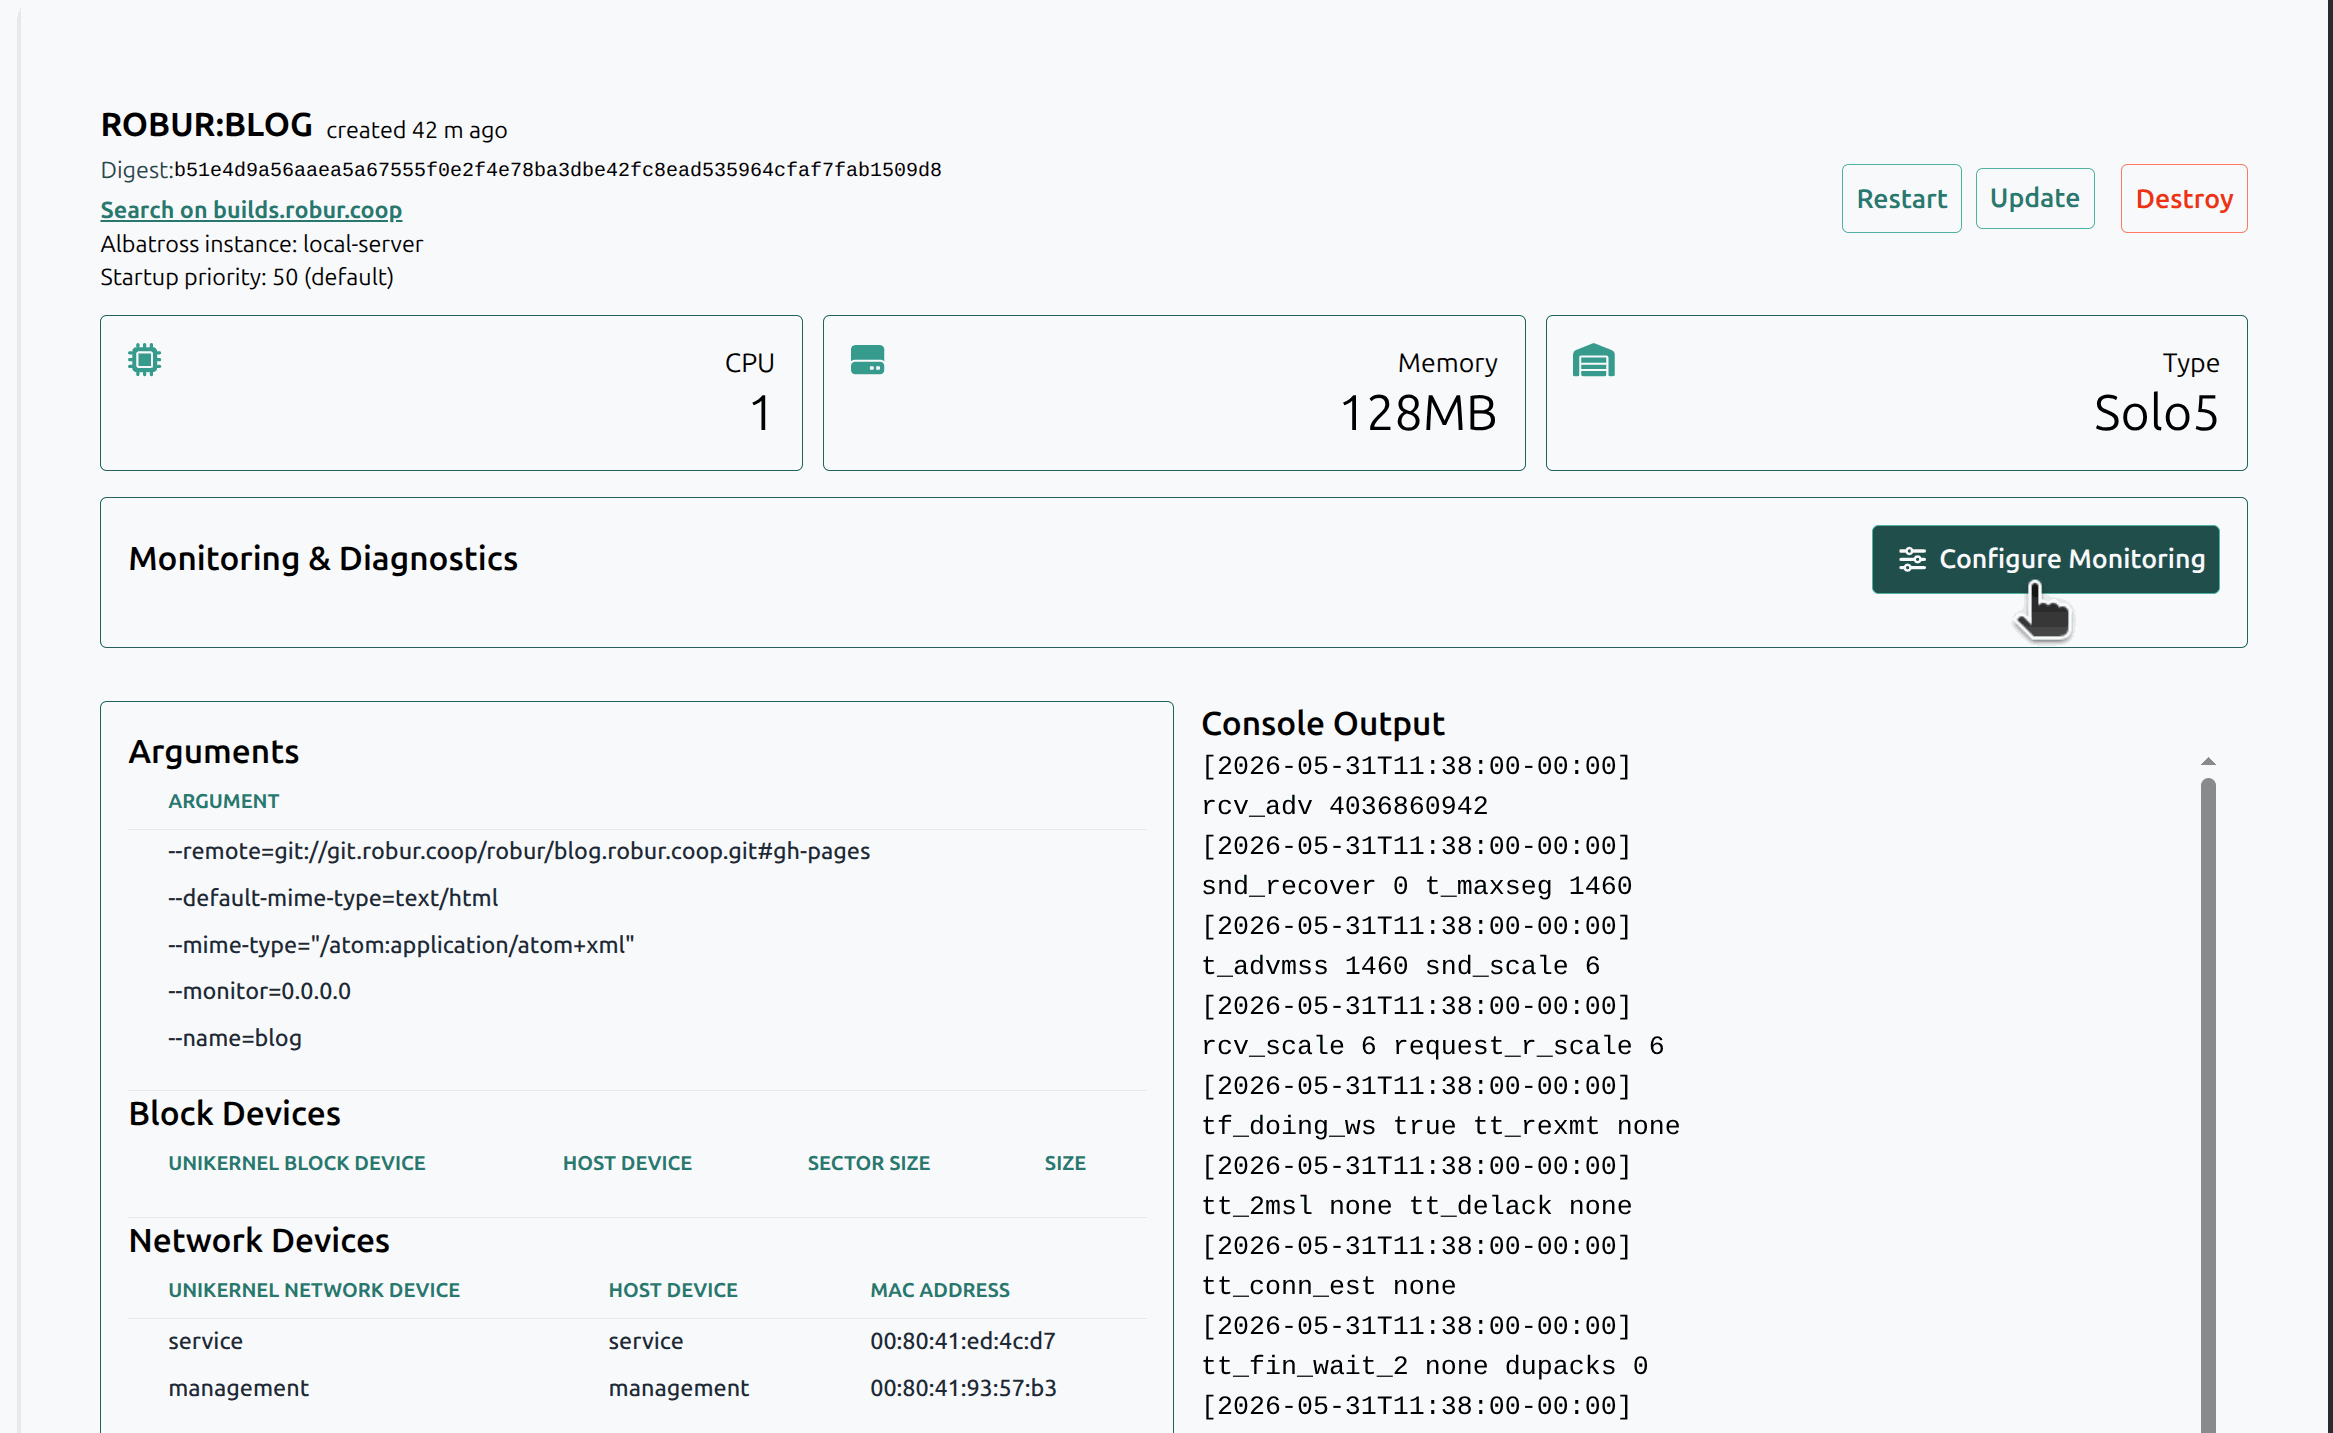
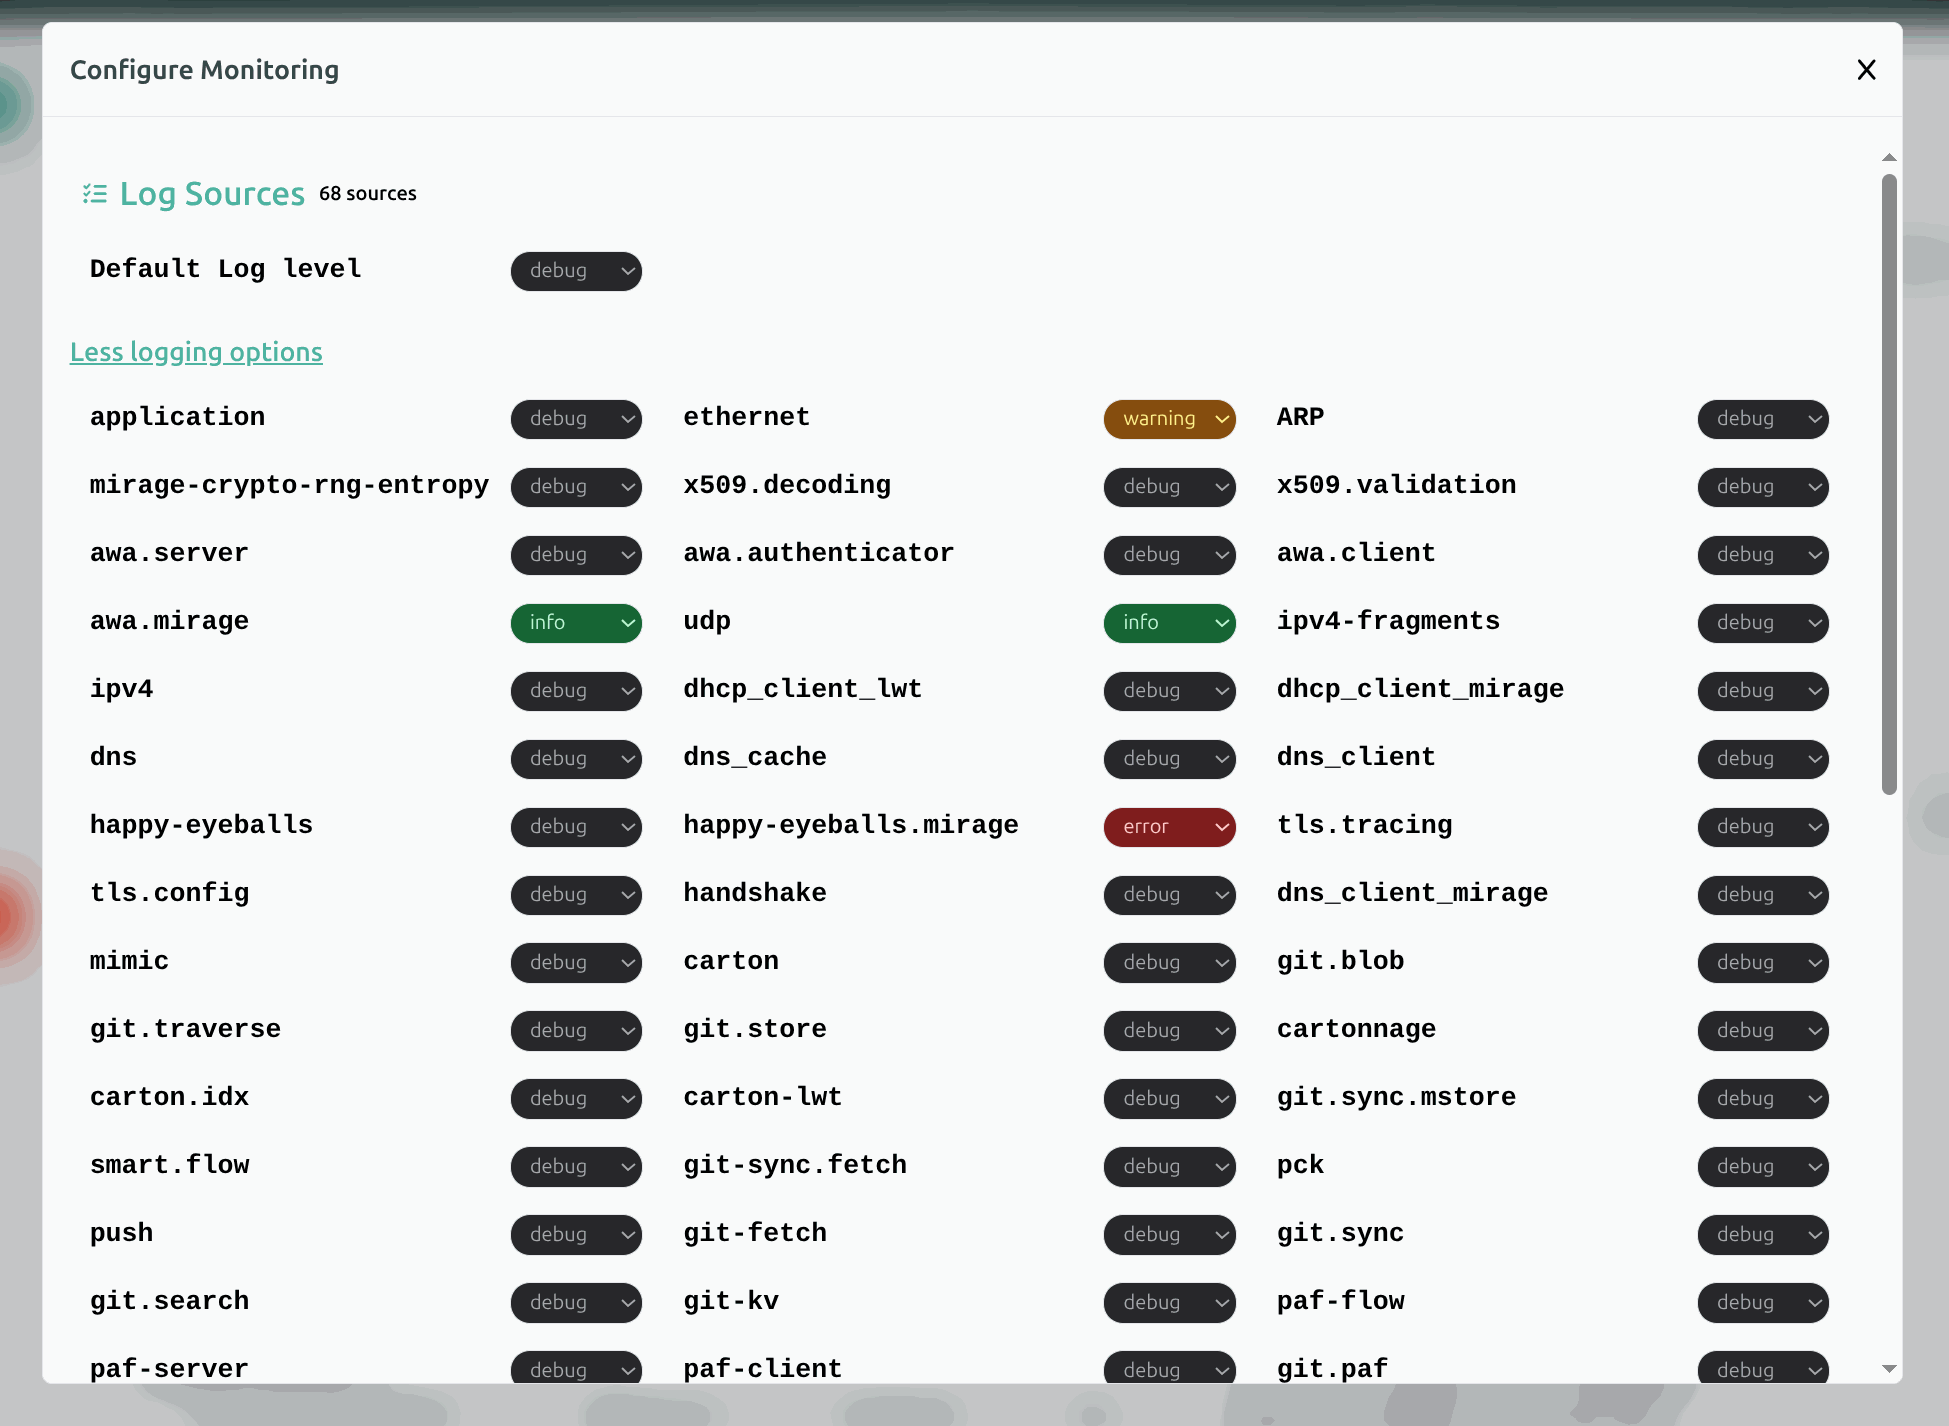
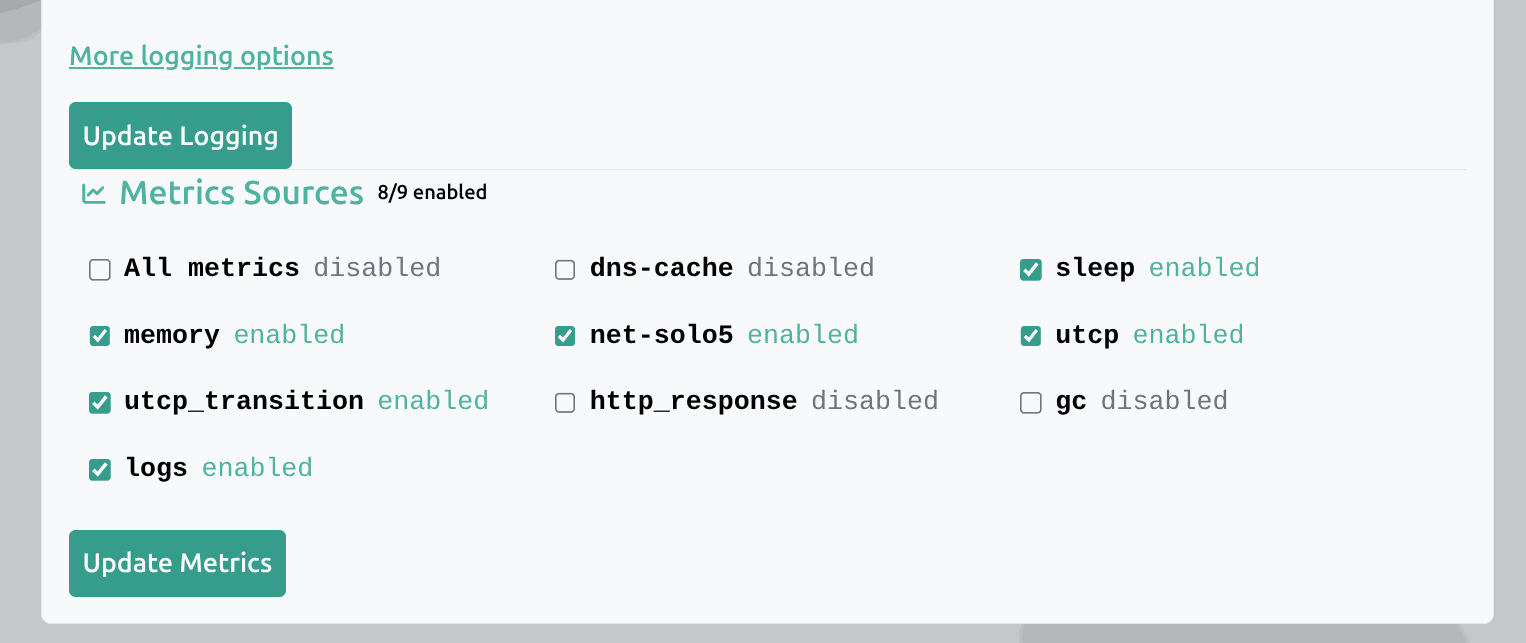
After clicking this button, you should see a modal list all the log sources and metrics:
- Log sources:
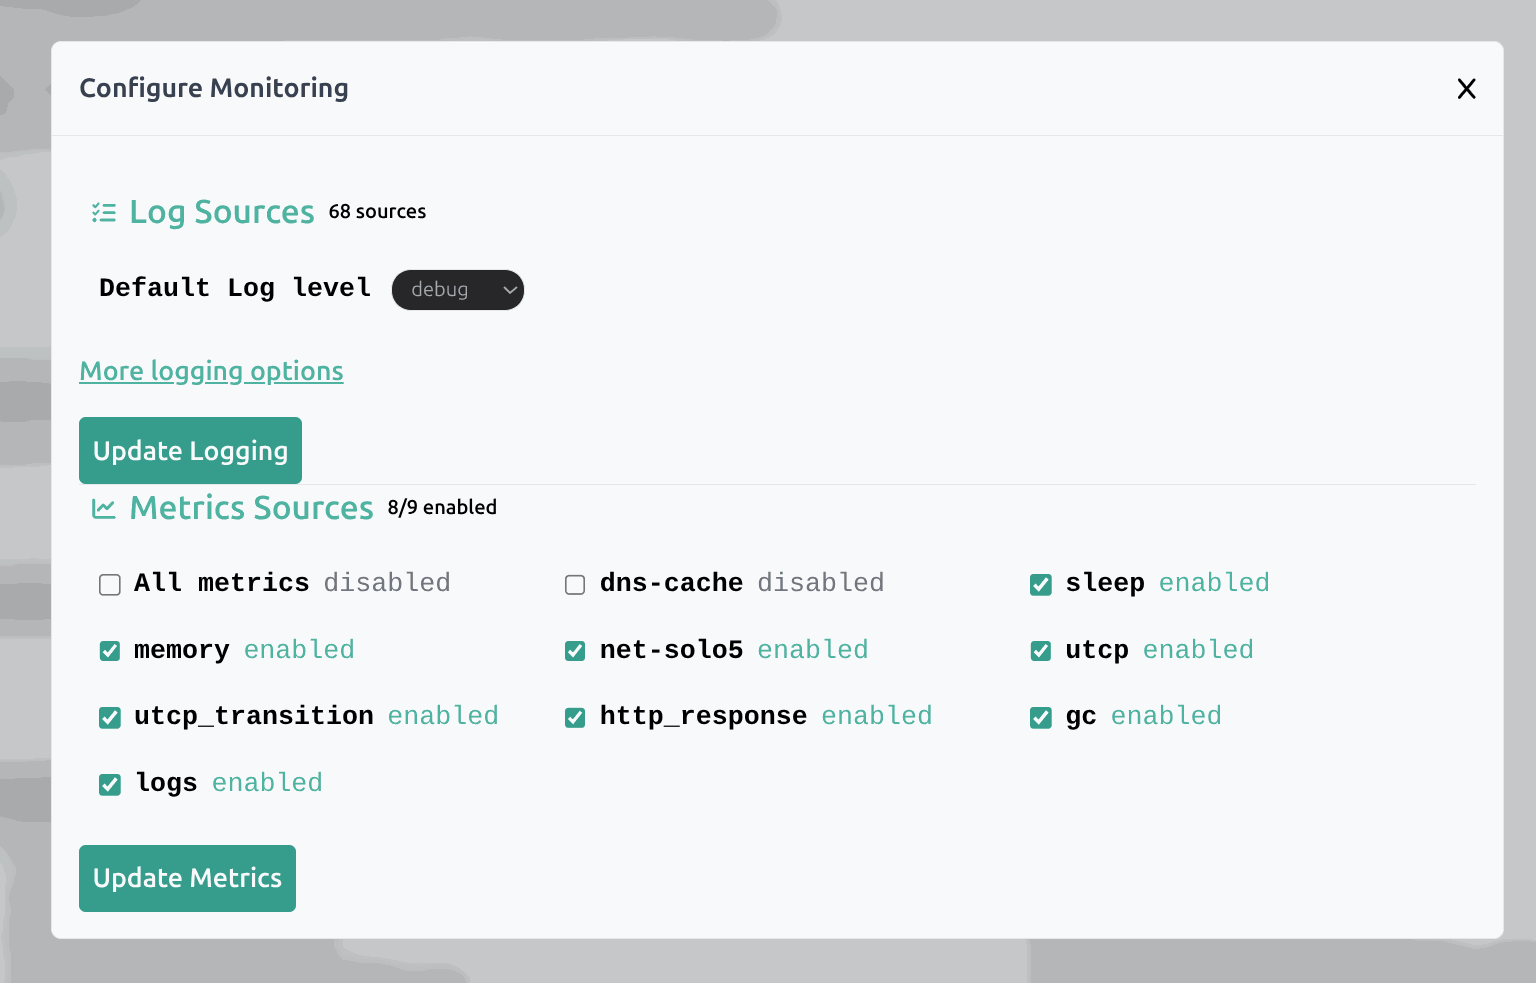
Here you can update the log level for all the log sources, or you can click "More logging options" to configure each source individually.
- Metrics:
You can also enable or disable metrics for each source individually, or for all sources at once.
Part C: Visualizing with Grafana
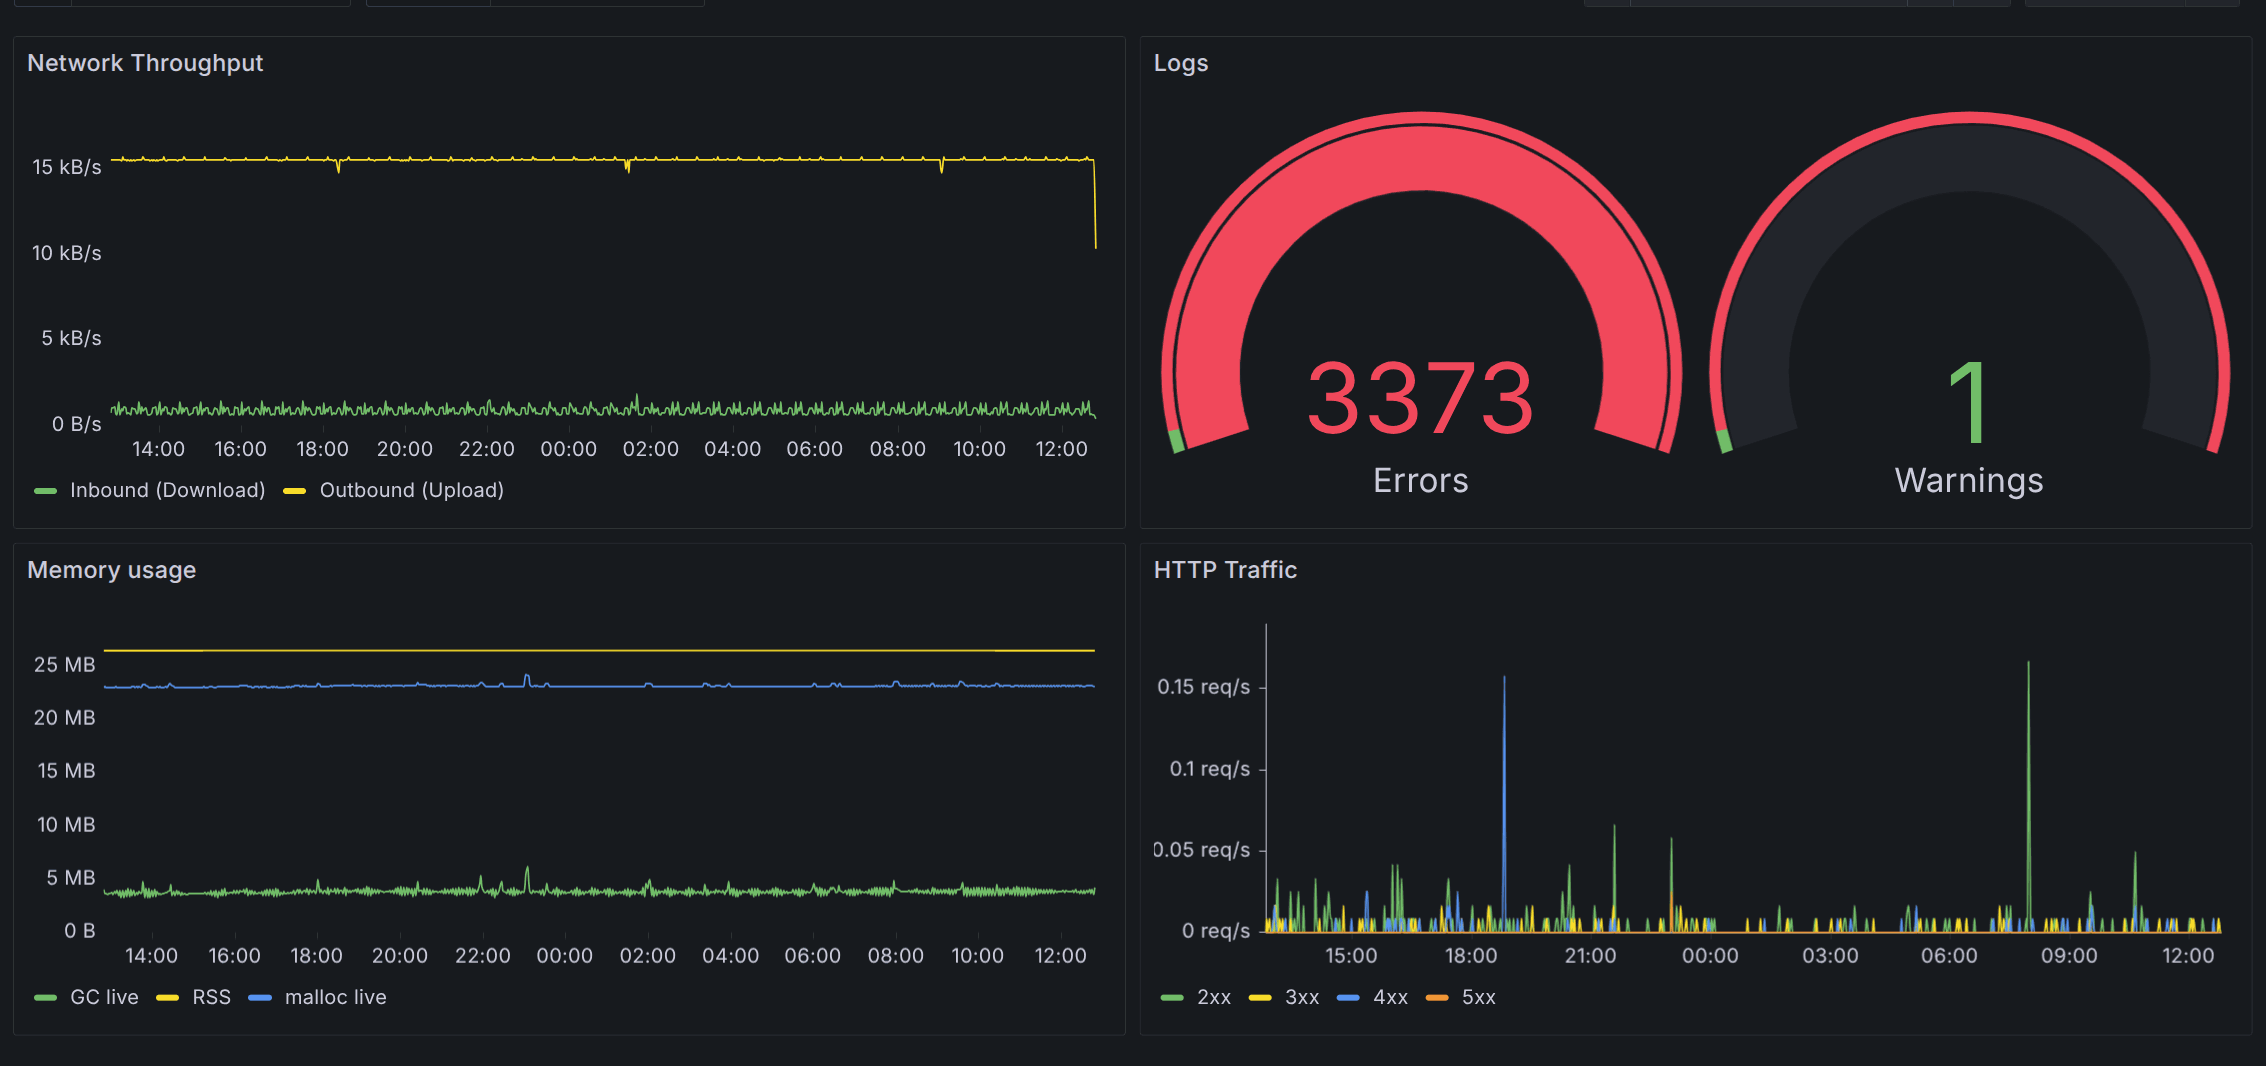
Once metrics are enabled, you can visualize them with Grafana. You will need to configure a few things in Grafana to achieve this such as your data source and dashboards. We use influxDB as our time series database.
Conclusion
Mollymawk simplifies the process of deploying and monitoring unikernels, as well as adjusting their log levels and metrics. You may want to debug why a certain function isn't working, and via mollymawk you can increase the log level of that source to prioritize it. In the near future, Mollymawk will also be able to emit a Grafana dashboard configuration, which you can upload to Grafana to visualize the metrics of your unikernels.