Grafana for MirageOS unikernels and other VMs
2026-06-18As hinted in our previous blog article, we've been working on gathering metrics of MirageOS unikernels and other virtual machines in a time series database, and displaying them in a Grafana dashboard.
Goal
Our goal is to correlate events (such as a HTTP request) to metrics: used bandwidth, CPU load, increased memory usage. Graphing these measurements over time with a fleet of unikernels (which use different libraries) allows us to conclude in which of our libraries resources are used a lot, and helps us to spot libraries with corner cases where resources are not properly released.
As example, a simple authoritative DNS server mostly uses UDP, as does our MirageVPN router. These unikernels have a solid low memory usage, also when running for months.
Grafana
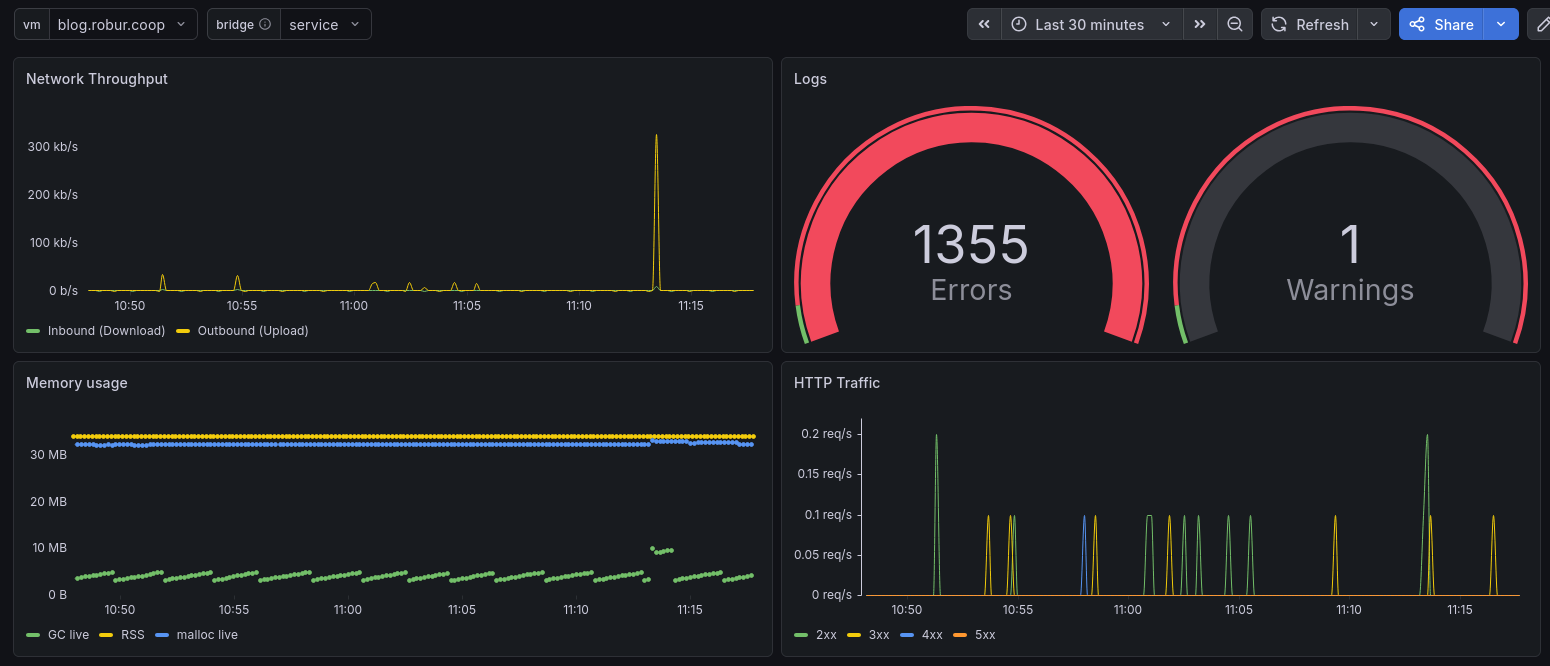
Above you see our dashboard, which includes four graphs: network throughput, log library statistics, memory usage, and HTTP traffic. In the graphs you can observe that at 11:13 there was a traffic spike in the network bandwidth, which correlates to a spike in HTTP requests, and a spike in the memory usage (esp. GC live).
What we see are both metrics from the unikernel itself (GC live, HTTP requests), as well as metrics from the host operating system about the unikernel (RSS, network usage). Each measurement is tagged with the unikernel name, so we can correlate the metrics from both inside (the unikernel) and outside (the host system). This is feasible since Albatross needs a name of the unikernel, and since September 2025 the MirageOS runtime accepts a --name argument for each unikernel (and albatross emits that). Before that, special care needed to be taken to keep the outside and inside name equal.
At the top left, there are two variables which are drop-down menus, one selecting the virtual machine (or unikernel) of the dashboard, the other selecting the network interface (bridge) for the network traffic. In our setup, metrics are transmitted on a dedicated, private-only (no access to the Internet) network - the same where log levels etc. can be adjusted. The reasoning behind that is separation of concerns and security. Thus, the network traffic you see above is only for the public-facing service, the monitoring data is not part of it.
The memory usage (resident set size, and malloc live) is higher than what the GC is aware of, the reasoning behind this is on the one side the unikernel image itself (the code) is mapped into memory - not managed by the GC; and also MirageOS still uses out-of-OCaml-heap so called BigArray data (which used to be important for Xen to have non-moving memory). These days, we're working hard on replacing these allocations by normal String.t and Bytes.t, so that the GC has a better understanding and thus its algorithms can deal more easily with MirageOS unikernels.
Software Stack
The metrics from the unikernel are gathered by the mirage-monitoring library; the metrics about the unikernel are gathered by albatross-stats.
Each measurement is sent to Telegraf and stored in InfluxDB - both running on the same physical machine as albatross and the unikernel. Grafana also runs on that host, and allows us to access the visualized data. All are open source components, and in our setup there is no cloud service involved.
Dashboard
The dashboard itself needs some configuration, i.e. what to query from InfluxDB, which variables are setup, etc. Mollymawk provides the dashboard shown above as json as /grafana.json. So when you setup mollymawk and have the monitoring in place, you can import that dashboard into Grafana and don't need to start from scratch.
Other virtual machine types
Monitoring with Grafana is, due to Mollymawk support for non-MirageOS virtual machines, also available for all virtual machines run by albatross. Of course, the virtual machine can as well report measurements to Telegraf/InfluxDB, so that can be visualized. But even with only measurements from the host system (RSS, network usage), this provides some insight how healthy the virtual machine is at the moment.
Conclusion
We record measurements of Unikernels and virtual machine, and graph them using Grafana. Our dashboard is exported to mollymawk, so it is easy to reproduce the setup. A powerful path is to collect measurements from both the virtual machine and the host system and be able to correlate them.